The Fish Health Inspectorate (FHI) Aquatic Trade and Technical Advice (ATTA) team manage all aspects of trade in live fish with other EU territories and report on the figures. We also do the following:
- give advice to customers
- authorise importers
- validate health certificates
- monitor incoming movements using the TRACES system – which is used by competent authorities within the EU to notify each other that movements are happening
- issue enforcement actions if required
Overview
In 2013, we handled 270 intra-community movements (within the EU), 198 of which were finfish. This represents a drop in finfish movements of approximately a third from 2012.
In 2014, there were 404 movements, 286 of which were finfish. Import levels in 2014 therefore returned to those in 2012.
Salmonids
The import trade in salmonid ova halved in 2013 (Table 1), dropping from 9.6 million in 2012 to 5.1 million. However 2014 (Table 2) saw a return to usual levels at 10.6 million.
Table 1. Summary of salmonid ova imported into England and Wales by month for 2013. Figures given in 1000s of ova.
| Country of Origin | |||||
| 2013 | Denmark | Isle of Man | Norway | Northern Ireland | Total |
| January | 170 | 50 | 2 | 250 | 472 |
| February | 100 | 490 | 0 | 0 | 590 |
| March | 320 | 0 | 0 | 1,215 | 1,535 |
| April | 0 | 150 | 0 | 0 | 150 |
| May | 625 | 50 | 0 | 0 | 675 |
| June | 0 | 0 | 0 | 200 | 200 |
| July | 0 | 0 | 0 | 50 | 50 |
| August | 0 | 0 | 0 | 0 | 0 |
| September | 0 | 0 | 0 | 150 | 150 |
| October | 0 | 0 | 0 | 820 | 820 |
| November | 100 | 0 | 2 | 64 | 166 |
| December | 250 | 50 | 0 | 0 | 300 |
| Total | 1,565 | 790 | 4 | 2,749 | 5,108 |
Table 2. Summary of salmonid ova imported into England and Wales by month for 2014. Figures given in 1000s of ova.
| Country of Origin | ||||||
| 2014 | Denmark | Isle of Man | Norway | Northern Ireland | Poland | Total |
| January | 100 | 90 | 156 | 0 | 0 | 346 |
| February | 300 | 31.5 | 0 | 0 | 0 | 331.5 |
| March | 400 | 225 | 0 | 700 | 0 | 1,325 |
| April | 950 | 0 | 0 | 175 | 0 | 1,125 |
| May | 830 | 0 | 0 | 0 | 0 | 830 |
| June | 0 | 0 | 0 | 310 | 0 | 310 |
| July | 0 | 0 | 0 | 645 | 0 | 645 |
| August | 450 | 0 | 0 | 0 | 0 | 450 |
| September | 600 | 0 | 0 | 1,020 | 0 | 1,620 |
| October | 400 | 0 | 0 | 0 | 0 | 400 |
| November | 500 | 50 | 0 | 170 | 0 | 720 |
| December | 0 | 0 | 2502 | 0 | 15 | 2,517 |
| Total | 4530 | 396.5 | 2658 | 3020 | 15 | 10,619.5 |
In the 6 years between 2009 and 2014, around 10 million ova were usually imported each year, although 2011 and 2013 saw dips to 5 million (Table 3). It is thought this could be an effect of economic issues.
Table 3. Summary of salmonid ova imported into England and Wales from 2009 to 2014. Figures given in 1000s of ova.
| Eire | Northern Ireland | Isle of Man | Denmark | Norway | Poland | Total | |
| 2009 | 20 | 260 | 2,110 | 7,553 | 0 | 0 | 9,943 |
| 2010 | 0 | 0 | 2,063 | 8,100 | 0 | 0 | 10,163 |
| 2011 | 0 | 6 | 801 | 4,705 | 0 | 0 | 5,512 |
| 2012 | 0 | 2,640 | 2,023 | 5,000 | 11.5 | 0 | 9,674.5 |
| 2013 | 0 | 2,749 | 790 | 1,565 | 4 | 0 | 5,108 |
| 2014 | 0 | 3,020 | 396.5 | 4,530 | 2,502 | 15 | 10,463.5 |
| Total | 20 | 8,675 | 8,183.5 | 31,453 | 2,517.5 | 15 |
Very few salmonids are imported as fry or older fish due to the requirement for additional health certification for Gyrodactylus salaris (Gs).
Other VHS and IHN susceptible species
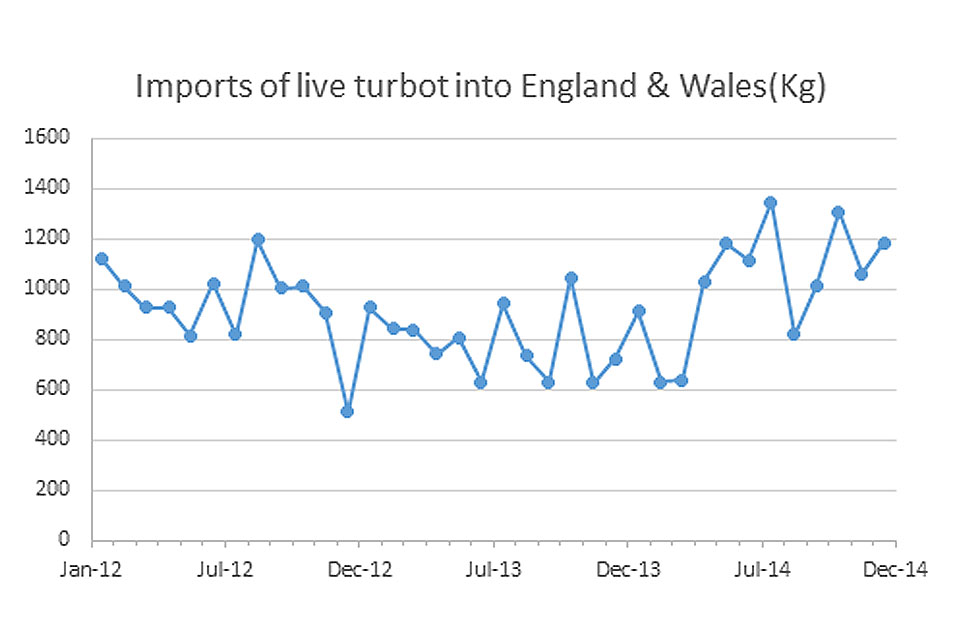
Trade in other VHS and IHN susceptible species remains predominantly live farmed turbot for the table. This trade also follows the trend of a dip in 2013, although not as substantial, with a return to 2012 levels in 2014 (Table 4).
Table 4. Summary of live turbot (VHS and IHN susceptible) imports into England and Wales from the EU by month for 2012 to 2014. Figures are given in Kg.
| 2012 | 2013 | 2014 | |
| January | 1,123 | 926 | 913 |
| February | 1,012 | 842 | 629 |
| March | 925.5 | 837 | 640 |
| April | 926.3 | 744 | 1,030 |
| May | 814.6 | 807 | 1,182 |
| June | 1023 | 632 | 1,116 |
| July | 820 | 943 | 1,347 |
| August | 1,198.6 | 735 | 820 |
| September | 1,003 | 631 | 1,012 |
| October | 1,011 | 1,045 | 1,310 |
| November | 906.5 | 628 | 1,063 |
| December | 511 | 724 | 1,185 |
| Totals | 11,274.5 | 9,494 | 12,247 |
SVC susceptible species
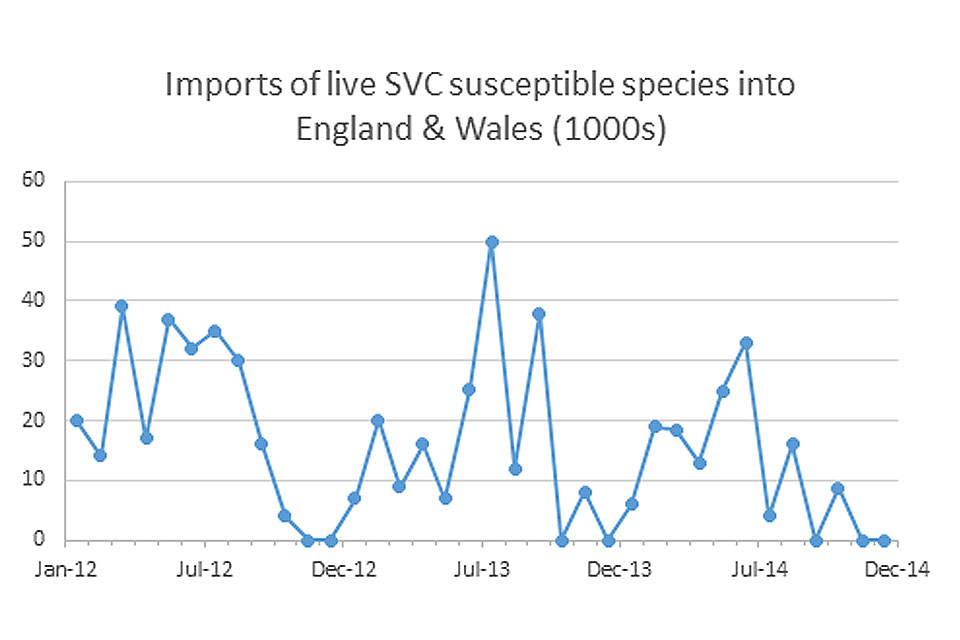
The trade in SVC susceptible species(such as goldfish and tench) from within the EU remains in decline and unlike most other species did not increase in 2014. Instead 2014 saw imports 40% lower than in 2012 (Table 5).
Table 5. SVC susceptible species imports into England and Wales from the EU by month from 2012 to 2014. Figures in 1000s of fish.
| 2012 | 2013 | 2014 | |
| January | 20 | 7 | 6 |
| February | 14 | 20 | 19 |
| March | 39 | 8.9 | 18.5 |
| April | 17 | 16 | 13 |
| May | 37 | 7 | 25 |
| June | 32 | 25.25 | 33 |
| July | 35 | 50 | 4 |
| August | 30 | 12 | 16 |
| September | 16 | 38 | 0 |
| October | 4 | 0 | 8.7 |
| November | 0 | 8 | 0 |
| December | 0 | 0 | 0 |
| Total | 244 | 192.15 | 143.2 |
Sturgeon
Sturgeon remain popular in the ornamental trade and imports followed the general trend with levels dropping in 2013 before recovering in 2014 - to around 45,000 fish. There is also growing interest in these species for the human consumption market.
Strict import conditions apply to sturgeon species, as they are vector species for both IHN and VHS. We therefore recommend that you contact the FHI for advice if you plan to import them. We can also advise on non-native species controls affecting the use of these species in Great Britain.
For more information regarding aquatic animal import data please contact me.
For updates, please sign up to email alerts from this blog, or you can follow us on Twitter @CefasGovUK.